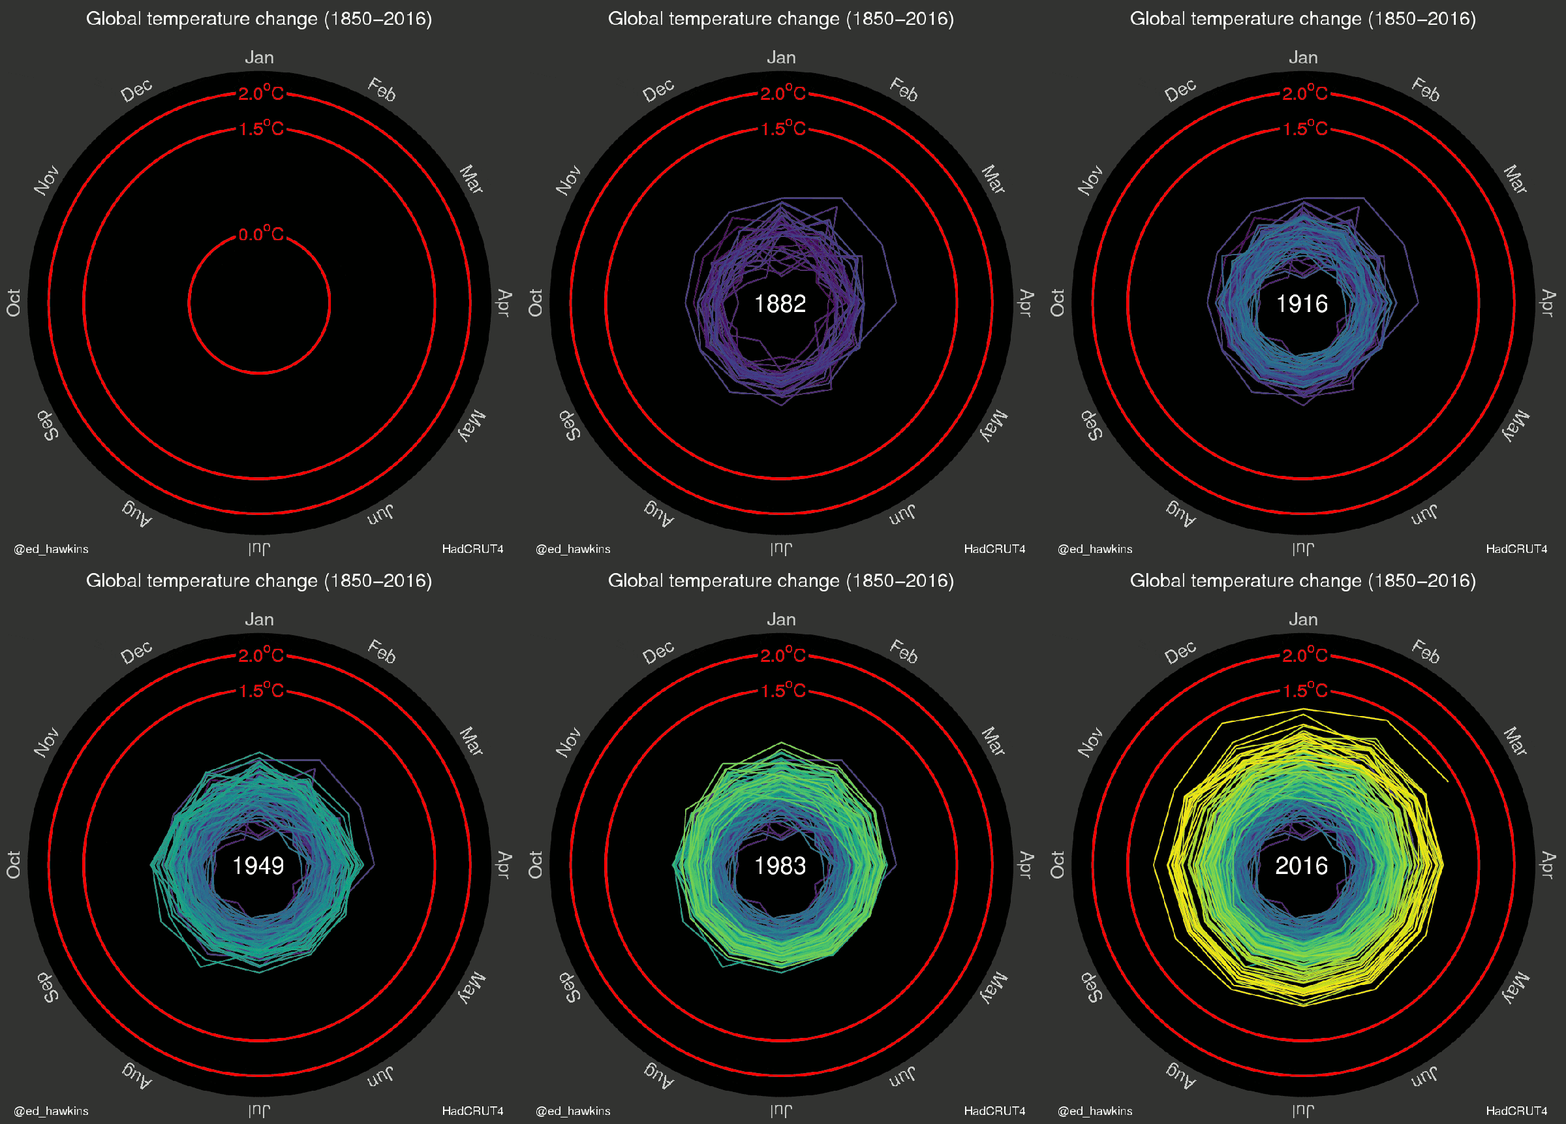
But we had so much snow this winter! But it’s only a couple degrees! But the temperature in my hometown feels fine! We’ve heard it all from climate change deniers. This elegant visualization sets the record straight.
The data supporting climate change is undeniable; we live in a hot world that’s getting hotter. And yet, even though that change is easy to document, it’s sometimes hard to get people to really see the overall climate trend when they’re thinking mostly about the weather they are personally experiencing. That’s why this mesmerizing new graph from climate scientist Ed Hawkins of the National Centre for Atmospheric Science at the University of Reading gives such an excellent overview of what’s really going on.
In the graph, Hawkins charts out every month’s temperature change since the 1850s into an outward expanding spirograph of climate data. Hawkins was also one of the contributing authors to the IPCC’s 5th climate assessment, which was full of plenty of alarming climate graphics and predictions of its own. This new presentation of that same climate data, though, lets the noise of tiny variations fade into the background while still showcasing, very simply, the undeniable trend.
“I think there is lots to see—variations from month to month and decade to decade,” Hawkins told Gizmodo. “I wanted to try and visualize the changes we have seen in different ways to learn about how we might improve our communication. The spiral appeared to present the information in an appealing and straightforward way. The pace of change is immediately obvious, especially over the past few decades. The relationship between current global temperatures and the internationally discussed target limits are also clear without much complex interpretation needed.”
#1: misterwhite To: Willie Green (#0)
Where did he get worldwide temperature data from, say, 1850 to 1950?
misterwhite posted on 2016-05-12 13:43:55 Reply Private Reply
#2: no gnu taxes To: Willie Green (#0)
You mean sensible people? The Klimate KOOKS told us we were doomed 20 years ago.
no gnu taxes posted on 2016-05-12 13:53:01 Reply Private Reply
#3: Logsplitter To: misterwhite (#1)
Logsplitter posted on 2016-05-12 14:42:49 Reply Private Reply
#4: misterwhite To: Logsplitter (#3)
Must have a big ass, since that was worldwide monthly data for 100 years. And precise, too -- looks like to 1/100th of a degree.
misterwhite posted on 2016-05-12 17:16:36 Reply Private Reply
#5: Willie Green To: misterwhite (#1)
HadCRUT4 dataset is a collaborative product of the Met Office Hadley Centre and the Climatic Research Unit at the University of East Anglia.
Unfortunately, the website is also a bunch of indecipherable British academic gobbledegook.
But since it's British, I would assume that many of the earlier data (1850~1900) dates back to routine daily observations recorded by the Royal Army & Navy in the far-flung reaches of the British Empire: either embassies or colonies in India, China, Africa or where ever... "The sun never sets on the British Empire" and keeping records of the daily weather was one of the more mundane, routine tasks.
Willie Green posted on 2016-05-12 17:53:23 Reply Private Reply
#6: SOSO To: misterwhite, Logsplitter (#4)
You are either delusional or ignorant or a shill. The basis and locations of where temperature data is taken, recorded AND reported has majorly changed over the 100 year period. And this is especially so since the Climate Change demagogue morons started relocating measureming points and FUDGING data over the past 30 years or so to spots that...........wait for it..................are notably, demonstrably hot spots (e.g. - from shade to full sunlight, nearer to exhaust sources than previous) simply to record higher temperatures than previously for that location.
Oh, BTW, what happened to the coming Ice Age that was predicted by many of these same morons in 1975? Oh, yeah, and the lack of global warming for the past 15 years or so?
Yes, little Virginia, the world's climate is changing as it has since the beginning of the planet and will to its end. I am still waiting for you Climate Change Chicken Littles to explain what caused the global warming that ended each and every one of the numerous Ice Ages experienced on the planet long before man was ever around, Perhaps you might learn something if you really wanted to.
SOSO posted on 2016-05-12 18:52:33 Reply Private Reply
#7: misterwhite To: SOSO (#6)
misterwhite posted on 2016-05-13 09:54:40 Reply Private Reply