
International News
See other International News Articles
Title: Arctic Ice Extent Reaches Record January Low
Source:
Capital Climate
URL Source: http://capitalclimate.blogspot.com/ ... ice-extent-reaches-record.html
Published: Feb 3, 2011
Author: NSIDC
Post Date: 2011-02-03 09:02:49 by go65
Keywords: None
Views: 27016
Comments: 44
Arctic sea ice extent averaged over January 2011 was 13.55 million square kilometers (5.23 million square miles). This was the lowest January ice extent recorded since satellite records began in 1979. It was 50,000 square kilometers (19,300 square miles) below the record low of 13.60 million square kilometers (5.25 million square miles), set in 2006, and 1.27 million square kilometers (490,000 square miles) below the 1979 to 2000 average. Ice extent in January 2011 remained unusually low in Hudson Bay, Hudson Strait (between southern Baffin Island and Labrador), and Davis Strait (between Baffin Island and Greenland). Normally, these areas freeze over by late November, but this year Hudson Bay did not completely freeze over until mid-January. The Labrador Sea remains largely ice-free.
Post Comment Private Reply Ignore Thread
Top • Page Up • Full Thread • Page Down • Bottom/Latest
#1. To: go65, no gnu taxes (#0)
I see arctic was spelled correctly in this article................
"Keep Your Goddamn Government Hands Off My Medicare!" - Various Tea Party signs.
Your level of discourse is apparent when all you have is comments on minor typos a week later.
I'm just ribbing you in the spelling error, we all make them. However your claims about arctic sensors did demonstrate a serious lack of knowledge.
Since January 3, 2011, Republicans have controlled the power of the purse.
Science is an exacting science.
"Keep Your Goddamn Government Hands Off My Medicare!" - Various Tea Party signs.
My point remains. If you think there are Arctic sensors away from human populations in remote highland areas that give true readings of of land temperatures, then describe where they are and how they compare to the sensors in the coastal populated areas. The Grrenalnd Nuuk weather station temperature measurements are extrapolated out over hundreds of sqaure miles.
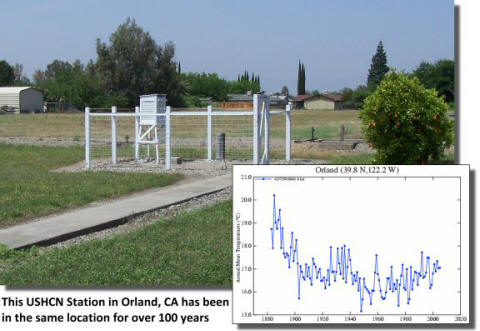
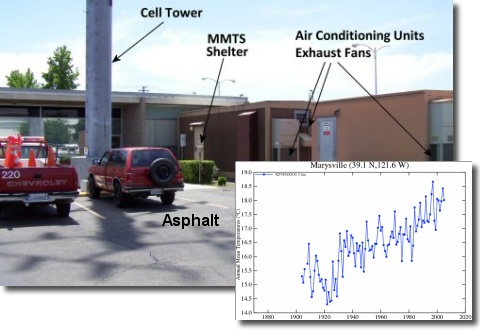
The urban heat island charge has never been proven by a scientific thesis. It is in fact a talking point that dates back a while now that has been used to try and dismiss data. I recall hearing about it in the 90s - the claims were that the earth was not getting warmer only that instruments are in cities and they get their temperature wrong because concrete and tarmac absorb heat, etc. It's a baseless thesis. But it has the ring of 'truthiness' to it.
"Keep Your Goddamn Government Hands Off My Medicare!" - Various Tea Party signs.
The urban heat island effect obviously exists, so I don't know what your point is. http://en.wikipedia.org/wiki/Urban_heat_island
The point is climate scientists know how to compensate for it. It is not skewing the data.
"Keep Your Goddamn Government Hands Off My Medicare!" - Various Tea Party signs.
They drastically changed the way it was compensated for in 1999 (if it is still compensated for at all) when there was little evidence of any global warming. I've posted the charts PROVING this.
http://www.grist.org/article/warming-is-due-to-the-urban-heat-island-effect/ (Part of the How to Talk to a Global Warming Skeptic guide) Objection: The apparent rise of global average temperatures is actually an illusion due to the urbanization of land around weather stations, the Urban Heat Island effect. Answer: Urban Heat Island Effect has been examined quite thoroughly (PDF) and found to have a negligible effect on temperature trends.
"Keep Your Goddamn Government Hands Off My Medicare!" - Various Tea Party signs.
http://www.powerlineblog.com/archives/2011/01/028246.php
LOL!! A 30 year record? There must not be any older people in climate bloggerville that can tell the others not to panic, it has been warmer before and it has been colder before.
Ever notice how we keep citing scientists and he keeps citing right wingers?
Since January 3, 2011, Republicans have controlled the power of the purse.
No they didn't as I showed you already this week. you keep posting the same bunk.
Since January 3, 2011, Republicans have controlled the power of the purse.
I gave you several examples. Now explain how the surface temperature record correlates with the satellite record if you believe surface temperatures are skewed by the urban heat island effect. Perhaps the satellites are located too close to stars?
Since January 3, 2011, Republicans have controlled the power of the purse.
James Hansen, the head of NASA's climate unit and one of the worst of the alarmists, said truthfully in 1999: The U.S. has warmed during the past century, but the warming hardly exceeds year-to-year variability. Indeed, in the U.S. the warmest decade was the 1930s and the warmest year was 1934. That didn't get the warmists where they were trying to go, so they have now changed the data by eliminating or drastically reducing the urban heat island effect. NASA now shows very different data for the period 1880-1999 from what it published in 1999. This animated GIF shows how the alarmists changed their own data to create the false impression of a climate crisis: Now, I know I’m not going to change the minds of any of the True Believers…those who read all of Reverend Al’s sermons, and say things like, “You know, global warming can mean warmer OR colder, wetter OR drier, cloudier OR sunnier, windier OR calmer, …”. Can I get an ‘amen’??
I previously debunked those charts, they appear to confuse north american and global sea ice and aren't sourced. It appears that the author simply made them up. You can keep posting them, but they won't get any more accurate.
Since January 3, 2011, Republicans have controlled the power of the purse.
well?
Since January 3, 2011, Republicans have controlled the power of the purse.
I gave you several examples. No you didn't. You just posted a chart saying there was no diferrence without giving specific sites. Here is a well maintained and well sited USHCN station: Here is a not-so-well maintained or well sited USHCN station: Now, I know I’m not going to change the minds of any of the True Believers…those who read all of Reverend Al’s sermons, and say things like, “You know, global warming can mean warmer OR colder, wetter OR drier, cloudier OR sunnier, windier OR calmer, …”. Can I get an ‘amen’??
These are NASA charts taken from THEIR records.
Now, I know I’m not going to change the minds of any of the True Believers…those who read all of Reverend Al’s sermons, and say things like, “You know, global warming can mean warmer OR colder, wetter OR drier, cloudier OR sunnier, windier OR calmer, …”. Can I get an ‘amen’??
i've asked you three times now to explain how the satellite record correlates with the land record if the land record is skewed. When are you done with that one, please explain how the surface land record correlates with the ocean record? At some point you need to stop reading right-wing blogs and Anthony Watts and learn to think for yourself. Source: http://www.skepticalscience.com/surface-temperature-measurements-advanced.htm
Since January 3, 2011, Republicans have controlled the power of the purse.
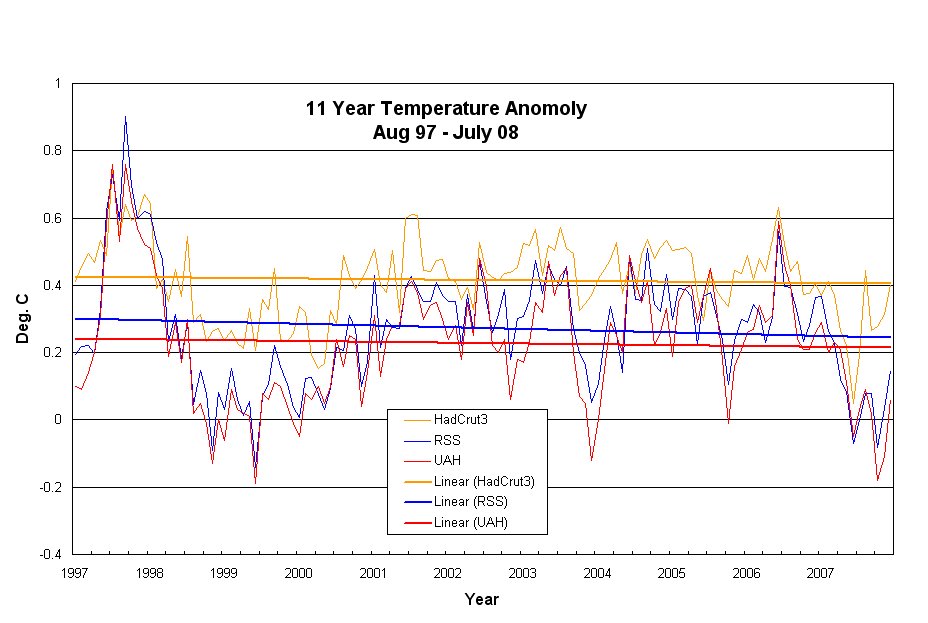
well? Both RSS and UAH show a cooling trend http://rankexploits.com/musings/2008/warming-on-11-year-hiatus-not-quite/
Now, I know I’m not going to change the minds of any of the True Believers…those who read all of Reverend Al’s sermons, and say things like, “You know, global warming can mean warmer OR colder, wetter OR drier, cloudier OR sunnier, windier OR calmer, …”. Can I get an ‘amen’??
Add 09 and 10 data in there and get back to me, OK? You really should ask yourself "why do I have to go back to data published in 2008 when newer data is available?" yeah, if you cherry pick hard enough you can find data that supports your predetermined conclusion, but if you look at the entire available range, you get something like this (based on 5 different reconstructions/observational data sets): Since January 3, 2011, Republicans have controlled the power of the purse.
only if you cherry pick certain limited years. Since January 3, 2011, Republicans have controlled the power of the purse.
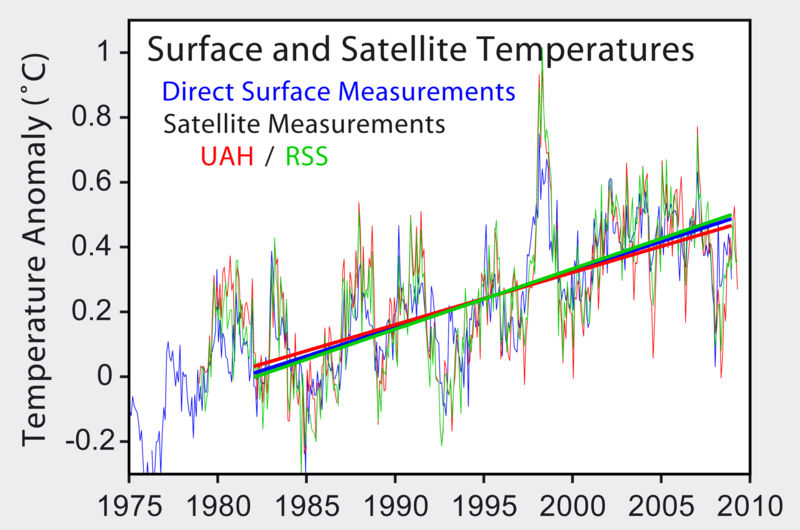
Godwin, the above chart is the death blow to No Gnu's claims that the surface measurements are skewed, the surface line (blue) correlates almost exactly with the satellite records (green/red). The RSS measurements accurately reflect more rapid upper troposphere warming as predicted by climate scientists. This uses his own data source against him. Game, set, match. You are toast NGT.
Since January 3, 2011, Republicans have controlled the power of the purse.
First of all this does not use raw satellite data. The satellite data is massaged to fit the land data. Second, look at those trend lines. Do you really think starting at a winter low point in 1983 and stopping at a summer high point in 2010 represents an unbiased "trend"? What would the trend be if you started at the high point in 1984 and stopped at the low point in 2009?
Now, I know I’m not going to change the minds of any of the True Believers…those who read all of Reverend Al’s sermons, and say things like, “You know, global warming can mean warmer OR colder, wetter OR drier, cloudier OR sunnier, windier OR calmer, …”. Can I get an ‘amen’??
Illuminati conspiracy....
"Keep Your Goddamn Government Hands Off My Medicare!" - Various Tea Party signs.
Look at this chart of actual data. It's clear land based sensors are consistently higher than satellite based ones.
Now, I know I’m not going to change the minds of any of the True Believers…those who read all of Reverend Al’s sermons, and say things like, “You know, global warming can mean warmer OR colder, wetter OR drier, cloudier OR sunnier, windier OR calmer, …”. Can I get an ‘amen’??
when facts fail you, resort to "it's all a conspiracy" Look at the entire record instead of cherry picking dates. Do you not see the rising trend since 1970? (all part of the conspiracy?) You have boxed yourself into a corner. You claim the land record is skewed, but you can't explain how then it correlates with both the sea and satellite records except to claim "it's a conspiracy", and you cherry pick data when the complete data record contradicts your claim. You are a completely dishonest debater. You really need to rethink your approach here. If you had facts to support your argument, you wouldn't have to resort to these sorts of tactics.
Since January 3, 2011, Republicans have controlled the power of the purse.
there are actually discrepancies between the satellite records, UAH shows slightly less warming than RSS, but they both show warming, and the trends are both entirely consistent with the surface temp records as I noted above. You've hit the end of the line in this line of arguing, time to find a new conspiracy theory.
Since January 3, 2011, Republicans have controlled the power of the purse.
From one of NGT's favorite sites: http://wattsupwiththat.com/2011/01/03/rss-data-2010-not-the-warmest-year-in-satellite-record-but-a-close-second/
Since January 3, 2011, Republicans have controlled the power of the purse.
No, RSS shows cooling and UAH shows an extremely small amount of warming (virtually a flat line). trends are both entirely consistent with the surface temp records as I noted above. The land based data is the only data with a definitive trend for increases.
Now, I know I’m not going to change the minds of any of the True Believers…those who read all of Reverend Al’s sermons, and say things like, “You know, global warming can mean warmer OR colder, wetter OR drier, cloudier OR sunnier, windier OR calmer, …”. Can I get an ‘amen’??
You are posting this because you agree 2010 was not the warmest year on record?
Now, I know I’m not going to change the minds of any of the True Believers…those who read all of Reverend Al’s sermons, and say things like, “You know, global warming can mean warmer OR colder, wetter OR drier, cloudier OR sunnier, windier OR calmer, …”. Can I get an ‘amen’??
So when cigarette companies presented data for decades showing cigarettes were not harmful, you dismissed it as all "kooky conspiracy" stuff?
Now, I know I’m not going to change the minds of any of the True Believers…those who read all of Reverend Al’s sermons, and say things like, “You know, global warming can mean warmer OR colder, wetter OR drier, cloudier OR sunnier, windier OR calmer, …”. Can I get an ‘amen’??
Given the mountain of evidence from independent sources showing that they were wrong, and the flaws in their methods, the evidence dismissed itself. No Gnu, I'm sorry but I'm done with you for the day. You have been hung out to dry with your own data sources. Enjoy the afternoon.
Since January 3, 2011, Republicans have controlled the power of the purse.
"There will be no more money when the U.S. dollar has no value, until that time we can keep printing more." -- go65, LF's answer to Ben Bernanke -- We always like cool X-rays, right? That's all go-bot has is the same old shit.
Well, [war's] got to do something for attention, his multiple personalities aren't speaking to him any more, and his imaginary friends keep finding excuses not to come over.
You go thread to thread hurling insults, afraid to actually debate a topic at hand, and then you attack me? Seriously? I may not agree with No Gnu Taxes but I give him credit for at least trying to engage in a reasoned debate (though I question his reasoning :-) ) WRT Eric, I put him on filter after he referred me to Eustace Mullins and started posting graphs that actually refuted his own points. Good day.
Since January 3, 2011, Republicans have controlled the power of the purse.
Indeed. When he actually tries to think, the stupid shit he writes is staggering, because it clearly demonstrates the magnitude of his mental derangement. Look at the quote in my sig, and you'll see what I mean. He's a LOON.
"There will be no more money when the U.S. dollar has no value, until that time we can keep printing more." -- go65, LF's answer to Ben Bernanke --
I notice now that war is back they are starting to hide behind the filter. Fred Mertz shows up on war's hip and puts me on filter because he can't take it. Now it looks like shmoe65 is taking the well-worn path. Losers.
Well, [war's] got to do something for attention, his multiple personalities aren't speaking to him any more, and his imaginary friends keep finding excuses not to come over.
Comments (41 - 44) not displayed.
Top • Page Up • Full Thread • Page Down • Bottom/Latest
#2. To: Godwinson (#1)
#3. To: no gnu taxes (#2)
Your level of discourse is apparent when all you have is comments on minor typos a week later.
#4. To: no gnu taxes, go65 (#2)
Your level of discourse is apparent when all you have is comments on minor typos a week later.
#5. To: go65 (#3)
However your claims about arctic sensors did demonstrate a serious lack of knowledge.
#6. To: no gnu taxes, go65 (#5)
#7. To: Godwinson (#6)
The urban heat island charge has never been proven by a scientific thesis.
#8. To: no gnu taxes (#7)
The urban heat island effect obviously exists, so I don't know what your point is.
#9. To: Godwinson (#8)
#10. To: no gnu taxes (#9)
(Edited)
#11. To: Godwinson (#10)
#12. To: go65 (#0)
Arctic Ice Extent Reaches Record January Low
#13. To: no gnu taxes (#11)
http://www.powerlineblog.com/archives/2011/01/028246.php
#14. To: no gnu taxes (#9)
They drastically changed the way it was compensated for in 1999 (if it is still compensated for at all) when there was little evidence of any global warming.
#15. To: no gnu taxes, godwinson (#5)
If you think there are Arctic sensors away from human populations in remote highland areas that give true readings of of land temperatures, then describe where they are and how they compare to the sensors in the coastal populated areas.
#16. To: go65 (#14)


#17. To: no gnu taxes (#16)
#18. To: (#15)
Now explain how the surface temperature record correlates with the satellite record if you believe surface temperatures are skewed by the urban heat island effect.
#19. To: go65 (#15)
If you think there are Arctic sensors away from human populations in remote highland areas that give true readings of of land temperatures, then describe where they are and how they compare to the sensors in the coastal populated areas.
#20. To: go65 (#17)
#21. To: no gnu taxes (#19)
(Edited)
No you didn't. You just posted a chart saying there was no diferrence without giving specific sites.
What about satellite measurements of temperatures in the lower troposphere? There are two widely cited analyses of temperature trends from the MSU sensor on NOAA's polar orbiting earth observation satellites, one from Remote Sensing Systems (RSS) and one from the University of Alabama-Huntsville (UAH). These data only go back to 1979, but they do provide a good comparison to the surface temperature data over the past three decades. Figure 7 shows a comparison of land, ocean, and global temperature data from the surface reconstructions (averaging the multiple analyses shown in figs. 3 and 4) and from satellites (averaging the results from RSS and UAH):

Figure 7. Comparison of temperatures from surface stations and satellite monitoring of the lower troposphere.
#22. To: go65 (#18)
Now explain how the surface temperature record correlates with the satellite record if you believe surface temperatures are skewed by the urban heat island effect.
#23. To: no gnu taxes (#22)
http://rankexploits.com/musings/2008/warming-on-11-year-hiatus-not-quite/

#24. To: no gnu taxes, godwinson (#22)
Both RSS and UAH show a cooling trend
#25. To: no gnu taxes, godwinson (#24)
(Edited)
#26. To: go65 (#24)
#27. To: no gnu taxes, go65 (#26)
First of all this does not use raw satellite data. The satellite data is massaged to fit the land data.
#28. To: go65 (#25)

#29. To: no gnu taxes, godwinson (#26)
First of all this does not use raw satellite data. The satellite data is massaged to fit the land data.
Do you really think starting at a winter low point in 1983 and stopping at a summer high point in 2010 represents an unbiased "trend"?
#30. To: no gnu taxes (#28)
It's clear land based sensors are consistently higher than satellite based ones.
#31. To: no gnu taxes, godwinson (#30)

#32. To: go65 (#30)
There are actually discrepancies between the satellite records, UAH shows slightly less warming than RSS, but they both show warming
#33. To: go65 (#31)
#34. To: go65 (#29)
#35. To: no gnu taxes (#34)
So when cigarette companies presented data for decades showing cigarettes were not harmful, you dismissed it as all "kooky conspiracy" stuff?
#36. To: go65 (#0)
(Edited)
Arctic Ice Extent Reaches Record January Low

Here's one of our own American Socialist,
"godwinson," resident socialist goober.![]()
#37. To: Capitalist Eric (#36)
#38. To: Rudgear (#37)
That's all go-bot has is the same old shit.
#39. To: Rudgear (#37)
That's all go-bot has is the same old shit.
#40. To: Capitalist Eric (#39)
.
.
.
[Home] [Headlines] [Latest Articles] [Latest Comments] [Post] [Mail] [Sign-in] [Setup] [Help] [Register]