
United States News
See other United States News Articles
Title: GLOBAL WARMING STRIKES FLORIDA!
Source:
[None]
URL Source: http://antzinpantz.com/kns/?p=36378
Published: Dec 14, 2010
Author: antzinpantz
Post Date: 2010-12-14 13:32:07 by no gnu taxes
Keywords: None
Views: 19276
Comments: 39
Here are some pictures of global warming on Florida’s Nature Coast. I woke up to these images this morning. Images which we normally don’t see until mid-January (if we do at all.) Images like how many of my plants are now dead like the one shown …. and especially those leaves buried in ice. Not a veneer of ice, either. It got down to 28 last night. Tonight? Around 18-24. Who can blame me for wanting to shove an icicle through the hearts of those global warming morons? 

Post Comment Private Reply Ignore Thread
Top • Page Up • Full Thread • Page Down • Bottom/Latest
#1. To: no gnu taxes (#0)
(Edited)
When someone argues that we won't have record lows or cold snaps, please let me know. Meanwhile: And: You're quite the moron...
Getting tired of the bozoed calcon following me around on the 'net, wanting to discuss "tossing salad." Sorry, you sick rump-ranger. NOT interested.
Arctic Sea Ice Increases at Record Rate http://noconsensus.wordpress.com/2009/02/03/arctic-sea-ice-increases-at-record-rate/
He was being sarcastic, goofy.
Old Eric isn't wrapped to tight.
Obama's first all-by-his-lonesome budget, btw, calls for a $1.17 trillion deficit.
Sigh. Peer Reviewed Paper: Current Arctic Sea Ice is More Extensive than Most of the past 9000 Years http://hockeyschtick.blogspot.com/2010/09/paper-current-arctic-sea-ice-is-more.html
What the HELL are you doing playing on the Internet? Get out there and work those smudge pots ... the orange grove could freeze!
Chuckle. Comment #1 from the above link: Just like you to take things out of context and claim they mean what they don't.
Did you read the second comment? -- Sure, I read the conclusion. Did you happen to read the final sentence? "It is important to note that the amplitude of these millennial-scale changes in sea-surface conditions FAR exceed those observed at the end of the 20th century." or the abstract: "The results of this study clearly show that sea-ice cover in the WESTERN Arctic Ocean has varied throughout the Holocene. MORE IMPORTANTLY, there have been times when sea-ice cover was less extensive than at the end of the 20th century." Regarding their discussion of the EASTERN Arctic, one of the same authors published a paper cited in the discussion about the bipolar behavior east vs. west. http://gizmo.geotop.uqam.ca/devernalA/de_Vernal_et_al_AGU_CH04_2009.pdf Which shows in Fig 6 that the "bipolar" east/west behavior began in the 1700's way before industrialization and the graph cuts off sometime in the 1800's. Therefore, the discussion about bipolar changes is referring to a time period BEFORE the 20th century. also look at Fig 9 showing the WESTERN Arctic back to 16,000 Y BP. and the abstract which states bipolar changes are not unlike those seen in the 20th century I'd like to know why western Arctic Sea Ice conditions over many many periods and FAR worse than the present didn't cause a tipping point due to decreased albedo at any time, but much better sea ice conditions are claimed to cause a tipping point now. Don't be so quick to assume I have "an agenda" - I just want to find the truth
Or perhaps, it was most pithily stated by the last commenter: -- MS, the global climate disruption cult believers will tolerate no variation from their dogma of Arctic ice death spiral and the end of the world.
yes, in the small area that they tested, which they note is an anomaly compared to the rest of the arctic, thus blowing your claim to shreds. paragraph 1: Care to keep digging?
There was an unusually unusually large increase over last winter, and in all likelihood, a similar increase over this winter. yes, in the small area that they tested, Maybe, but no evidence is presented why this was not representative. The paper was peer reviewed. As was stated Which shows in Fig 6 that the "bipolar" east/west behavior began in the 1700's way before industrialization and the graph cuts off sometime in the 1800's. Therefore, the discussion about bipolar changes is referring to a time period BEFORE the 20th century. also look at Fig 9 showing the WESTERN Arctic back to 16,000 Y BP. and the abstract which states bipolar changes are not unlike those seen in the 20th century I'd like to know why western Arctic Sea Ice conditions over many many periods and FAR worse than the present didn't cause a tipping point due to decreased albedo at any time, but much better sea ice conditions are claimed to cause a tipping point now.
You can easily look this stuff up: The paper didn't claim what you claimed it did. That's the flaw. We didn't have a massive build-up of atmospheric CO2 like we're seeing now.
You can easily look this stuff up: I did. For example here. http://hernadi-key.blogspot.com/2009/02/arctic-sea-ice-increases-at-record-rate.html And it will return just as fast this winter. This has more to do with ocaen patterns than anything else. The paper didn't claim what you claimed it did. That's the flaw. Yes it did. You have no evidence to the contrary other than the AGW cult scare tactics. We didn't have a massive build-up of atmospheric CO2 like we're seeing now. And you can provide no proof that any additional CO2 can provide any additional greenhouse effects.
That is from February of 2009, we have much newer data as I already posted several times. Take another look. That is absolute B.S. http://www.skepticalscience.com/empirical-evidence-for-co2-enhanced-greenhouse-effect.htm BTW: http://news.nationalgeographic.com/news/2009/04/090406-sea-ice-younger.html That is from February of 2009, we have much newer data as I already posted several times. MUCH newer? We're talking 10 months ago. Arctic ice always declines over the summer. Ans if you will look at the comments at your source that presumably "demonstrates" that increased CO2 at current atmospheric levels necessarily results in increased trapped infrared radiation, you might see that this assertion is bullshit.
Arctic ice continued its decline this winter, with hardy, thicker old ice increasingly being replaced with quick-to-melt, thinner young ice, according to a new report by NASA and the National Snow and Ice Data Center. This winter's maximum Arctic sea ice extent was 5.85 million square miles (15,150,000 square kilometers)—about 278,000 square miles (720,000 square kilometers) less than the Arctic average between 1979 and 2000. "That's a loss about the size of the state of Texas," said Walter Meier of the National Snow and Ice Data Center (NSIDC) in Boulder, Colorado. "We used to have a winter ice maximum about twice the size of the lower 48 United States," Meier added. See a pattern here? I guess we've been getting this thinner, younger ice every year since...forever.
forever only goes back to 2006? See a pattern here: Remember 100 degrees and drought September? Of course not. Ending Grain Stox now at their lowest ever. Tipping Point past, unless Immediate Industrial Collapse, which of course will happen. ;}
History was yesterday. ;}
el nino
So you're saying forever goes back to 1978? And it's misleading. Break it up into 2 graphs. 1978-1994 and 1994-2010. And include an endpoint in 2010 after the winter ice buildup rather than the summer melt, and you get a much different picture. It appears (if this is even correct) there were large melts in 1995 and 2006, but hardly any pattern of gradually declining Arctic ice. Look at ocean patterns during the years of melt and you probably have a much more realistic picture of what actually occurred than blaming this on CO2.
I'm saying that the claim "Peer Reviewed Paper: Current Arctic Sea Ice is More Extensive than Most of the past 9000 Years" isn't supported by any evidence, including the paper you cited.
If you have to modify the data to get the result you want, you have a problem. Look at the blue line.
You're looking at 25 years of data as evidence of what has gone on for 9000 years? Just because ice levels may be somewhat lower in the past years doesn't mean that even the lower level isn't higher than most of the last 9000 years.
That's the modified data. Or more so, using just the data you want to do to get the results you planned. There was no loss of ice between 1978 and 1994. An really just 2 big years of lost ice between 1995 and 2010, probably the result of ocean currents if the matter were researched. Why does the graph conveniently stop at the peak of 2010 summer ice loss? Over the the next few months the amount of arctic ice will increase substantially.
Great, let us know when you can do the research and have your hypothesis peer reviewed. Meanwhile, study after study shows declines. Here's another data source: Nope. El Nino's the influence of the Indian Ocean, itself the infkuence of the Melting Arctic, the slowing N Atlantic Therhaline Conveyor. But it doesn't matter now. We're past the Bifurcation Point ans Civilization has ZERO plans to change. Catabolic Collapse of Industrial Society is the only answer now. See USbp Ecocide for details. ;}
Are we really doomed James?
He can't reply, he's been evacuated from the Gulf Coast! HEHEHEHEHE!!!!!
The IEA, the same folks who've been denying PO up until their latest 2010 missive (the same missive saying 60% of new oil production next 50 years will be coming from 'yet to be found' fields;}, Says a 3.5 degree C rise is now 'baked in'. 2 degree plus brings us runaway. "Corporations and others whose business it is to extract benefits from large numbers of people for their profit have long since perfected the fostering of that lottery mentality. The party of their political puppets spends its time and its sponsors’ money convincing people that all “liberal” ideas will take away the fortune they will certainly one day make. Then once in charge, these puppets create rules that ensure that those same people have almost no chance of making a fortune. This explanation is simply an example of how we have become check-mated by our own ability to understand abstractions. Other societies, for example Islamic societies, have created a social organization that prevents their members from responding to the threats facing the species in the very near term. Although the steps taken in those societies are different from those taken here, and would require a detailed history to reconstruct, there is at least one technique they share: they make outrageous charges of conspiracy and perjury against all rationalists, and they demonize science as an illegitimate belief system, much of which, they claim, is made up by an underground of conspirators. They have no cognitive dissonance, however, when they accept the benefits of science (medicine, jet airplanes, telecommunications) when at the same time arguing that evolution and climate science are hoaxes." Humans are no smarter than yeast or Easter Island or St Matthew's Island deer. And if we are, we will collapse our systems now. A Catch 22.
Some like you certainly are not, mcclown.
That a large portion of the powers-that-be allow this kind of anti-rational babbling, even encourage it, shows that they are willing to stop at nothing to maintain their power. What is the intellectual’s proper response to that? There is none, because the intellect is not considered a legitimate faculty for making decisions. Ancient texts by pre-scientific peoples are treated as equal to science, and the scientifically illiterate pollute the discourse on public policy questions with their arrogant tripe, making the stupidest claims with a kind of arrogance that comes from knowing that they walk arm-in-arm with the economic forces that govern our public policy decisions.
Hey dumbass, why don't you learn how to post?

On January 3, 2011 the GOP assumes responsibility for deficit spending.
#2. To: All (#1)
(Edited)

On January 3, 2011 the GOP assumes responsibility for deficit spending.
#3. To: no gnu taxes (#0)
GLOBAL WARMING STRIKES FLORIDA!
LMAO!!!!!!!!!
#4. To: go65 (#2)
#5. To: Capitalist Eric (#3)
#6. To: no gnu taxes (#5)
#7. To: no gnu taxes (#4)
(Edited)
http://noconsensus.wordpress.com/2009/02/03/arctic-sea-ice-increases-at- record-rate/

Arctic sea ice extent averaged over November 2010 was 9.89 million square kilometers (3.82 million square miles). This is the second-lowest November ice extent recorded over the period of satellite observations from 1979 to 2010, 50,000 square kilometers (19,300 square miles) above the previous record low of 9.84 million square kilometers (3.80 million square miles) set in 2006.
Ice extent was unusually low in both the Atlantic and Pacific sectors of the Arctic and in Hudson Bay. Typically by the end of November, nearly half of Hudson Bay has iced over. But on November 30, only 17% of the bay was covered by sea ice. Compared to the 1979 to 2000 average, the ice extent was 12.4% below average for the Arctic as a whole.
On January 3, 2011 the GOP assumes responsibility for deficit spending.
#8. To: go65 (#7)
#9. To: no gnu taxes (#0)
#10. To: no gnu taxes (#8)
http://hockeyschtick.blogspot.com/2010/09/paper-current-arctic-sea-ice-is-more.html
I must assume you read the conclusion of the paper, and therefore you are fully aware of the deceptive nature of your misrepresentation of this work.
http://bprc.osu.edu/geo/publications/mckay_etal_CJES_08.pdf
In the case I might be incorrect, please consider the actual conclusion of the authors, with my emphasis<
=========================
"The Holocene record from site HLY0501-05 illustrates the sensitivity of hydrographical conditions in the western Arctic Ocean. The data show a long-term warming that is >>opposite to what is reconstructed for the eastern Arctic<< and point to a >>bipolar behavior<< of the Arctic Ocean at the timescale of the Holocene. The millennial-scale variability >>in the eastern Chukchi Sea<< is characterized by quasi-cyclic periods of high SSS, high SST, and reduced sea-ice cover, which most probably reflects variations in the stratification of the upper water column.
=========================
The authors analyzed a >>small sub-region<< of the arctic and noted that it was anomalous. You on the other hand attempt to apply their sub-regional analysis to the general. While this clearly fits your agenda, it does not represent the meaning of the research.
Perhaps you might invite the authors to comment on your interpretation of thier paper? No...I think you won't.
On January 3, 2011 the GOP assumes responsibility for deficit spending.
#11. To: go65 (#10)
#12. To: go65 (#10)
#13. To: no gnu taxes (#11)
(Edited)
"It is important to note that the amplitude of these millennial-scale changes in sea- surface conditions FAR exceed those observed at the end of the 20th century."
There is clear evidence that over the last 30 years the Arctic has been experiencing dramatic environmental changes (e.g., Serreze et al. 2000; Comiso and Parkinson 2004). Most notably, there has been a rapid decline in the extent and thickness of sea-ice in summer and more recently in winter as well (e.g., Parkinson et al. 1999; Comiso 2002; Serreze et al. 2003; Rigor and Wallace 2004; Meier et al. 2005
On January 3, 2011 the GOP assumes responsibility for deficit spending.
#14. To: go65 (#13)
Most notably, there has been a rapid decline in the extent and thickness of sea-ice in summer and more recently in winter as well (e.g., Parkinson et al. 1999; Comiso 2002; Serreze et al. 2003; Rigor and Wallace 2004; Meier et al. 2005
#15. To: no gnu taxes (#14)
(Edited)
There was an unusually unusually large increase over last winter, and in all likelihood, a similar increase over this winter.
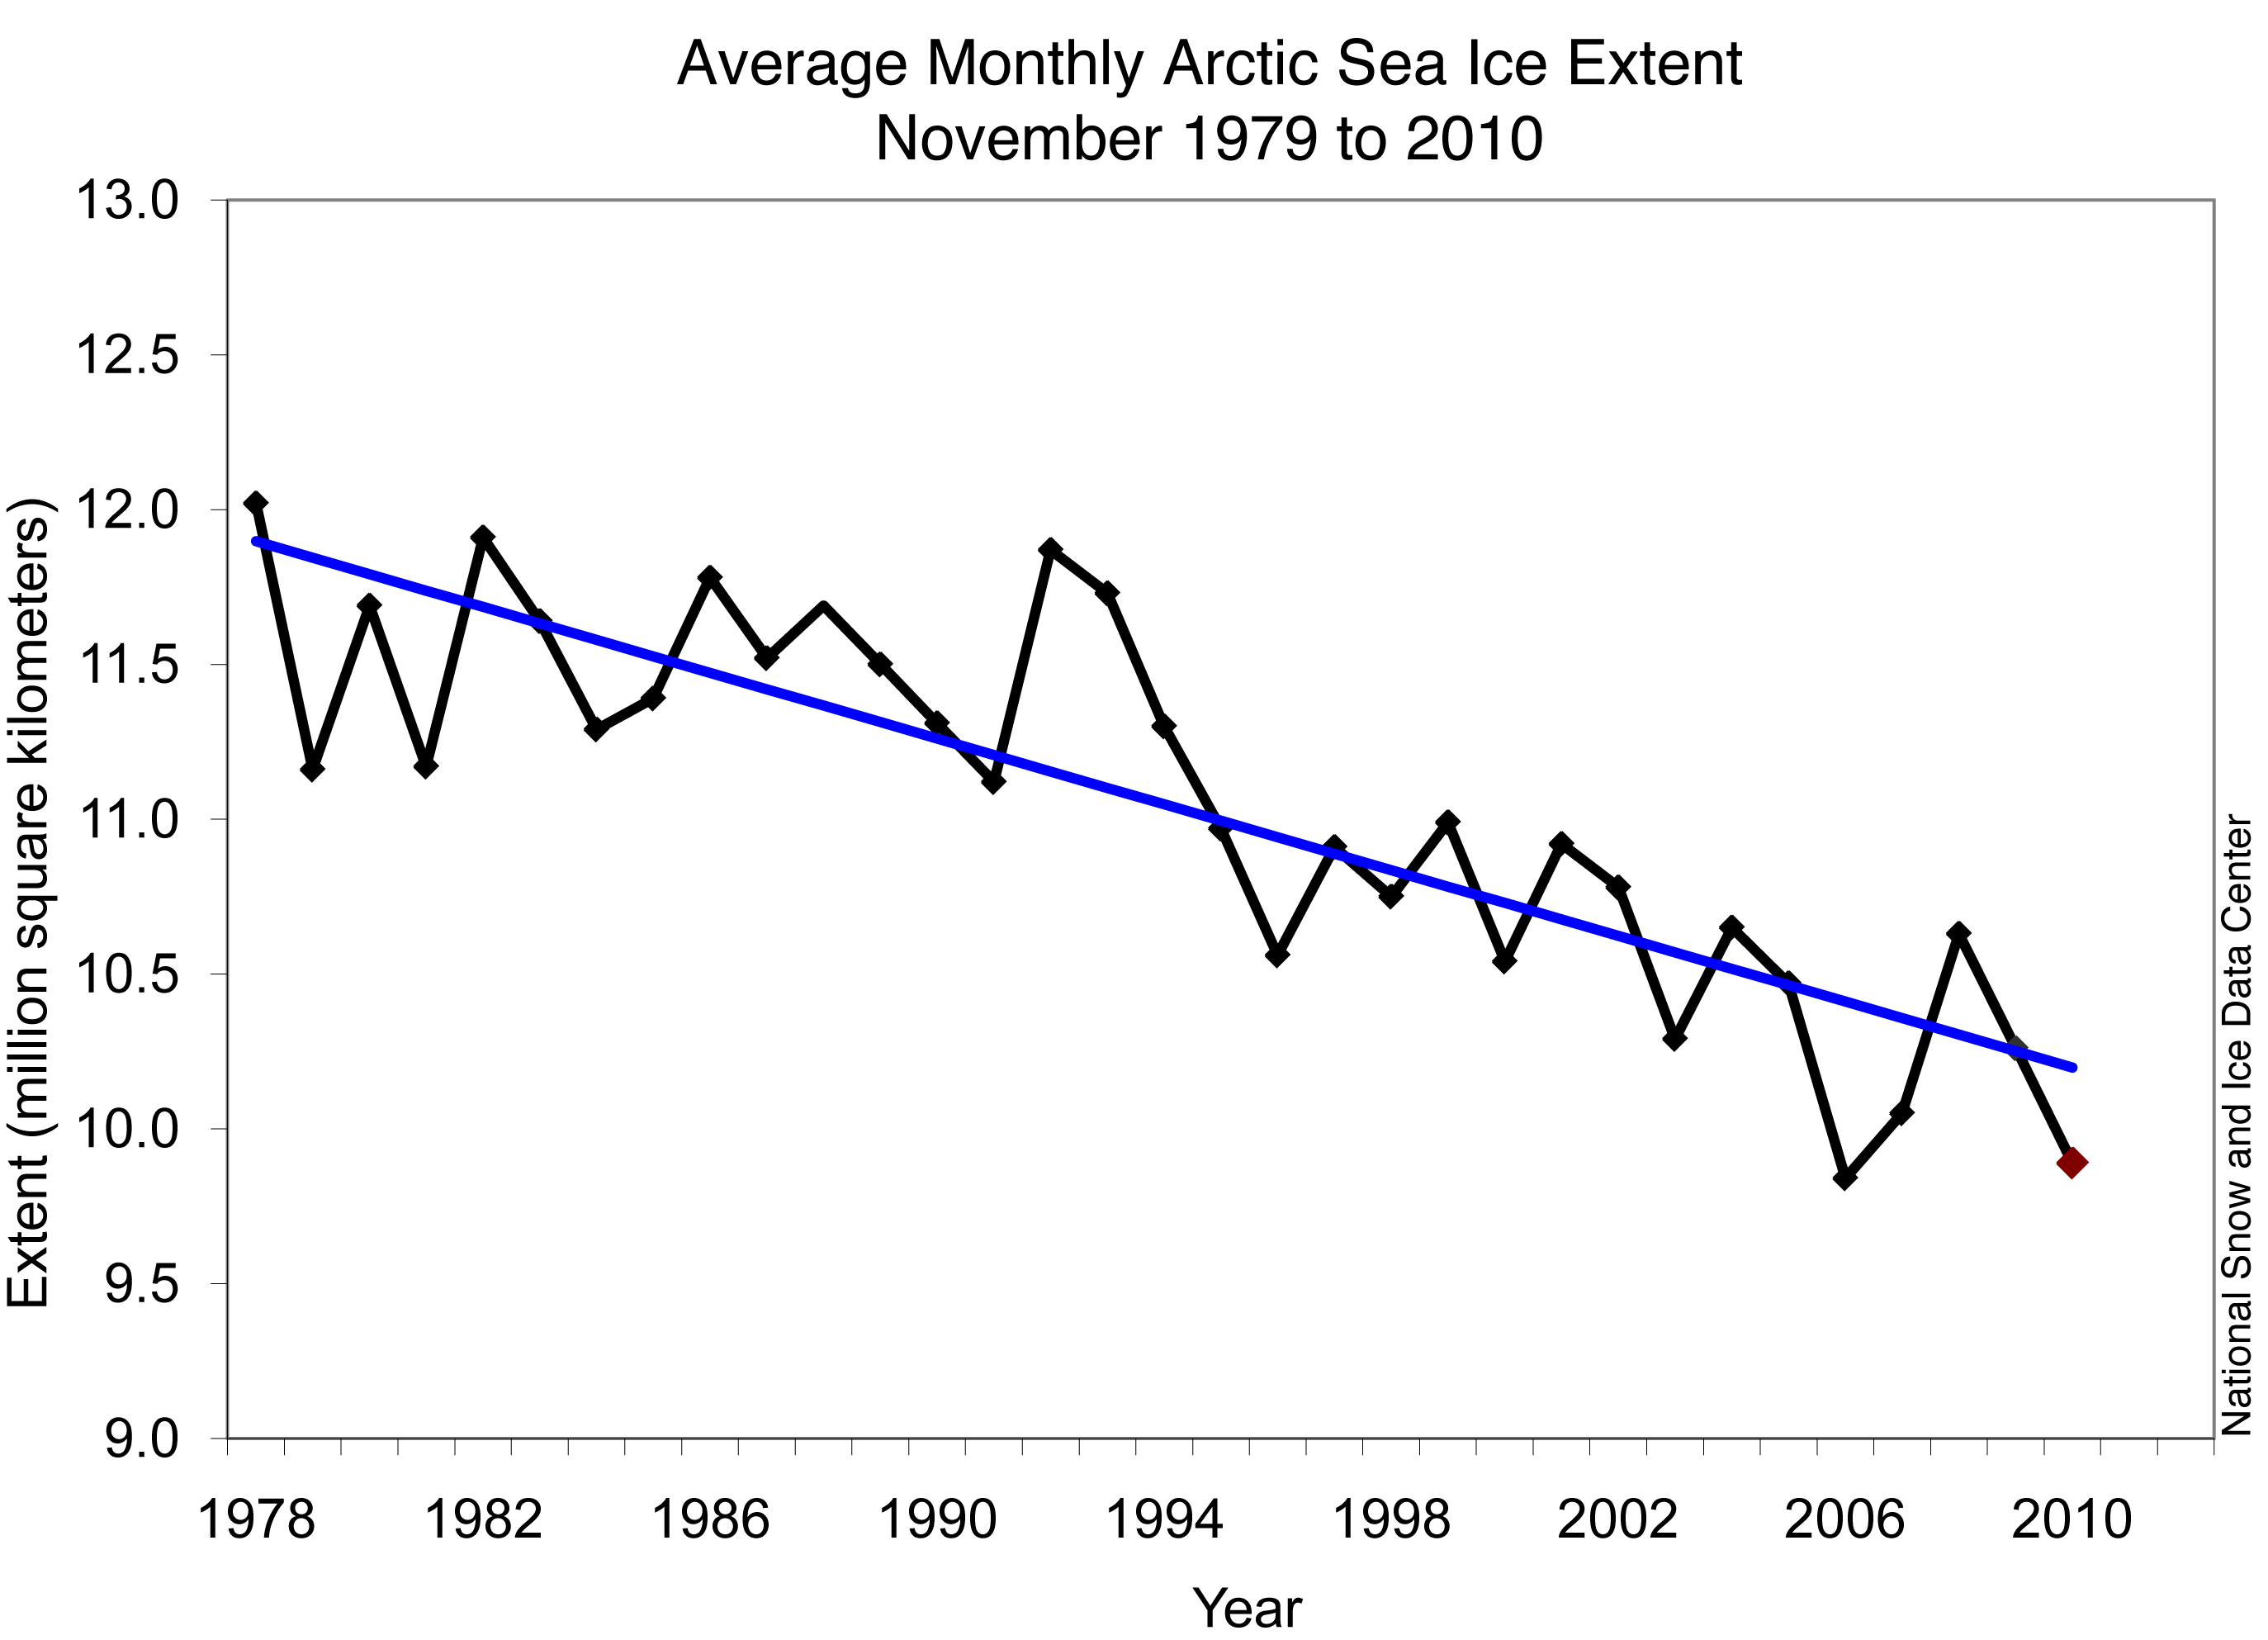
November 2010 had the second-lowest ice extent for the month since the beginning of satellite records. The linear rate of decline for the month is –4.7 % per decade.
http://nsidc.org/arcticseaicenews/
aybe, but no evidence is presented why this was not representative. The paper was peer reviewed.
I'd like to know why western Arctic Sea Ice conditions over many many periods and FAR worse than the present didn't cause a tipping point due to decreased albedo at any time, but much better sea ice conditions are claimed to cause a tipping point now.
On January 3, 2011 the GOP assumes responsibility for deficit spending.
#16. To: go65 (#15)
There was an unusually unusually large increase over last winter, and in all likelihood, a similar increase over this winter.
#17. To: no gnu taxes (#16)
http://hernadi-key.blogspot.com/2009/02/arctic-sea-ice-increases-at-record-rate.html
And you can provide no proof that any additional CO2 can provide any additional greenhouse effects.
In 1970, NASA launched the IRIS satellite that measured infrared spectra between 400 cm-1 to 1600 cm-1. In 1996, the Japanese Space Agency launched the IMG satellite which recorded similar observations. Both sets of data were compared to discern any changes in outgoing radiation over the 26 year period (Harries 2001). The resultant change in outgoing radiation was as follows:

Figure 1: Change in spectrum from 1970 to 1996 due to trace gases. 'Brightness temperature' indicates equivalent blackbody temperature (Harries 2001).
What they found was a drop in outgoing radiation at the wavelength bands that greenhouse gases such as carbon dioxide (CO2) and methane (CH4) absorb energy. The change in outgoing radiation is consistent with theoretical expectations. Thus the paper found "direct experimental evidence for a significant increase in the Earth's greenhouse effect".
This result has been confirmed by subsequent papers using more recent satellite data. The 1970 and 1997 spectra were compared with additional satellite data from the NASA AIRS satellite launched in 2003 (Griggs 2004). This analysis was extended to 2006 using data from the AURA satellite launched in 2004 (Chen 2007). Both papers found the observed differences in CO2 bands matching the expected changes from rising carbon dioxide levels. Thus we have empirical evidence that increased CO2 is causing an enhanced greenhouse effect.
Surface measurements of downward longwave radiation A compilation of surface measurements of downward longwave radiation from 1973 to 2008 find an increasing trend of more longwave radiation returning to earth, attributed to increases in air temperature, humidity and atmospheric carbon dioxide (Wang 2009). More regional studies such as an examination of downward longwave radiation over the central Alps find that downward longwave radiation is increasing due to an enhanced greenhouse effect (Philipona 2004).
Taking this a step further, an analysis of high resolution spectral data allows scientists to quantitatively attribute the increase in downward radiation to each of several greenhouse gases (Evans 2006). The results lead the authors to conclude that "this experimental data should effectively end the argument by skeptics that no experimental evidence exists for the connection between greenhouse gas increases in the atmosphere and global warming."

Figure 2: Spectrum of the greenhouse radiation measured at the surface. Greenhouse effect from water vapor is filtered out, showing the contributions of other greenhouse gases (Evans 2006).
There are multiple lines of empirical evidence that increasing carbon dioxide causes an enhanced greenhouse effect. Laboratory tests show carbon dioxide absorbs longwave radiation. Satellite measurements confirm less longwave radiation is escaping to space at carbon dioxide absorptive wavelengths. Surface measurements find more longwave radiation returning back to Earth at these same wavelengths. The result of this energy imbalance is the accumulation of heat over the last 40 years
On January 3, 2011 the GOP assumes responsibility for deficit spending.
#18. To: no gnu taxes (#16)
Arctic ice continued its decline this winter, with hardy, thicker old ice increasingly being replaced with quick-to-melt, thinner young ice, according to a new report by NASA and the National Snow and Ice Data Center.
This winter's maximum Arctic sea ice extent was 5.85 million square miles (15,150,000 square kilometers)—about 278,000 square miles (720,000 square kilometers) less than the Arctic average between 1979 and 2000.
"That's a loss about the size of the state of Texas," said Walter Meier of the National Snow and Ice Data Center (NSIDC) in Boulder, Colorado.
"We used to have a winter ice maximum about twice the size of the lower 48 United States," Meier added.
On January 3, 2011 the GOP assumes responsibility for deficit spending.
#19. To: go65 (#17)
http://hernadi-key.blogspot.com/2009/02/arctic-sea-ice-increases-at-record-rate.html
#20. To: no gnu taxes (#19)
http://news.nationalgeographic.com/news/2009/04/090406-sea-ice-younger.html
On January 3, 2011 the GOP assumes responsibility for deficit spending.
#21. To: go65 (#20)
#22. To: no gnu taxes (#21)
(Edited)
On January 3, 2011 the GOP assumes responsibility for deficit spending.
#23. To: no gnu taxes (#0)
#24. To: go65 (#22)
#25. To: mcgowanjm (#23)
#26. To: go65 (#22)
#27. To: no gnu taxes (#26)
So you're saying forever goes back to 1978?
On January 3, 2011 the GOP assumes responsibility for deficit spending.
#28. To: no gnu taxes (#26)
Break it up into 2 graphs. 1978-1994 and 1994-2010. And include an endpoint in 2010 after the winter ice buildup rather than the summer melt, and you get a much different picture.
On January 3, 2011 the GOP assumes responsibility for deficit spending.
#29. To: (#28)
#30. To: go65 (#27)
Current Arctic Sea Ice is More Extensive than Most of the past 9000 Years
#31. To: go65 (#28)
Look at the blue line.
#32. To: no gnu taxes (#31)
(Edited)
There was no loss of ice between 1978 and 1994. An really just 2 big years of lost ice between 1995 and 2010, probably the result of ocean currents if the matter were researched.

On January 3, 2011 the GOP assumes responsibility for deficit spending.
#33. To: no gnu taxes (#25)
#34. To: mcgowanjm (#33)
#35. To: Fred Mertz, mcgowanjm (#34)
Are we really doomed James?

#36. To: Fred Mertz (#34)
Are we really doomed James?
#37. To: mcgowanjm (#36)
Humans are no smarter than yeast or Easter Island or St Matthew's Island deer.
#38. To: All (#36)
#39. To: go65 (#15)
Top • Page Up • Full Thread • Page Down • Bottom/Latest
[Home] [Headlines] [Latest Articles] [Latest Comments] [Post] [Mail] [Sign-in] [Setup] [Help] [Register]